
Population Is Not Demand: Why Size Alone Is a Poor Starting Point for Choosing an Asian Market

A leadership team preparing its first move into Asia usually opens the conversation with a number. Most often it is population, or the size of the market. Both are easy to find, both are large for the region’s biggest economies, and both feel objective.
That ease is the risk. The first number on the table tends to shape the shortlist, and the shortlist shapes everything the company spends in the following two years. For an Entry Brand with limited capital and no local track record, the question is less which market looks biggest and more what the company is actually choosing when it picks a measure.
The mistake is treating “size” as one number that ranks markets from best to worst. It is at least three: how many people live in a market, how much the category earns today, and how fast it is expected to grow. They do not agree. Sports nutrition shows how far apart they sit.
| Market | Population | Sports-nutrition market | Projected CAGR |
|---|---|---|---|
| India | 1,463.9m (2025) | US$678.7m (2025) → US$1,803.5m (2033) | 13.0% (2026–2033) |
| Japan | 123.4m (2025) | US$3,198.0m (2025) → US$6,324.6m (2033) | 8.9% (2026–2033) |
| South Korea | 51.7m (2025) | US$1,876.4m (2023) → US$3,048.2m (2030) | 7.2% (2024–2030) |
| China | Approx. 1.4bn (year varies) | US$3,135.8m (2025) → US$8,633.4m (2033) | 13.5% (2026–2033) |
Sources: World Bank (population); Grand View Research sports-nutrition outlooks. South Korea’s market-size base year is 2023 and forecast periods differ, so CAGRs are comparable only as a direction.
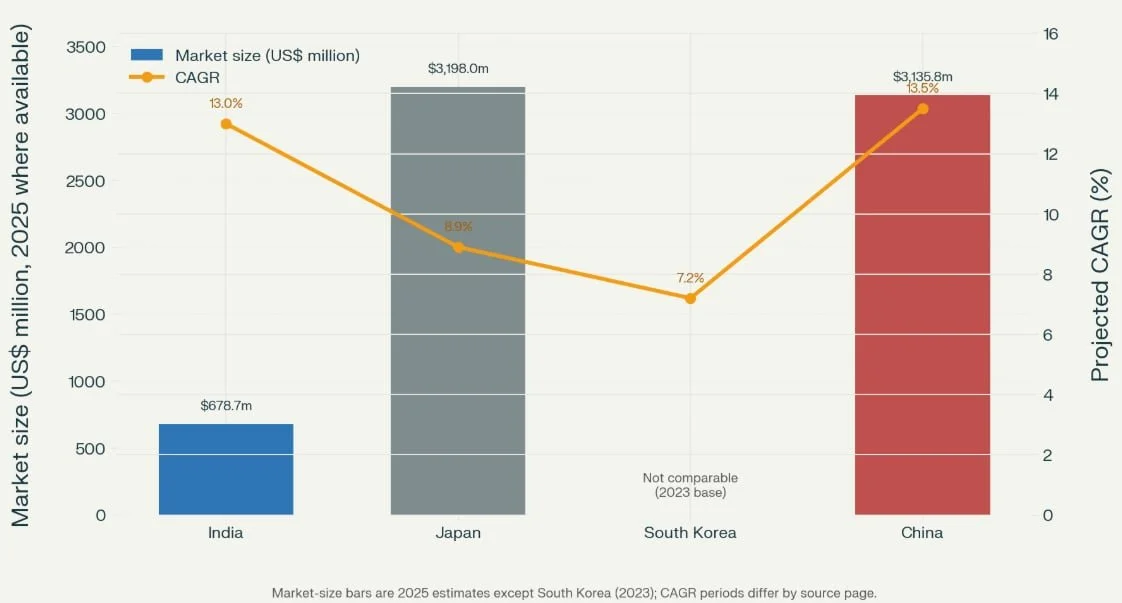
Market size (US$ million, 2025 where available) and projected CAGR (%). South Korea’s market-size bar is omitted because the available figure is a 2023 base-year value.
Rank the four by population and India comes first. Rank them by current category revenue and Japan and China lead, with India last. Rank them by projected growth and China and India lead. A team that starts with one column will arrive at a different shortlist from a team that starts with another, and neither will know that the starting column made the decision.
Population is not category demand. India has roughly 11.9 times Japan’s population, yet its 2025 sports-nutrition market is about US$679 million against Japan’s US$3.2 billion. Japan’s market is about 4.7 times larger. Spread across residents, that is about US$0.46 of category revenue per person in India against about US$25.9 in Japan, a gap of roughly 56 times (Samana calculation). China shows the same pattern. Its population is approximately 1.4 billion, yet its 2025 market of US$3.1 billion is close to Japan’s.
Population describes a potential audience. It does not say how many people already buy the category, what they pay or how a brand would reach them.
Growth rate is not opportunity size. India’s projected 13.0% CAGR is 4.1 percentage points above Japan’s 8.9%. India is projected to grow about 2.7 times between 2025 and 2033, Japan about 2.0 times. But Japan is projected to add roughly US$3.1 billion of annual category revenue over that period, India roughly US$1.1 billion (Samana calculation). India does not overtake Japan in absolute size. What a faster rate may offer is a category still being built, which could suit an entrant seeking position rather than immediate revenue.
The data has limits, and so does any ranking built on it. India, Japan and China are reported on 2025 figures with 2026–2033 forecasts. South Korea’s market size is a 2023 figure, with a 2024–2030 forecast. Its 2023 market of US$1,876.4 million is already about 2.8 times India’s 2025 market, which is exactly the kind of comparison that looks tidier than it is.
There is a more important limit. None of these figures describes what it costs to reach customers in a market, compete there or build the operating capability to serve it. A large market can still be a poor first market if those costs outweigh the advantage of its size. The numbers above cannot settle that.
Companies that make better early market decisions separate the measures and decide what each is for. Population is context. Current category revenue shows how established demand already is. Growth shows where the category is heading.
They also state their objective before choosing the measure. A company seeking early revenue from existing category buyers is asking a different question from one seeking to build a position while a category develops. Neither is wrong. When the objective is left unstated, the first metric chosen becomes the objective by default.
Scenario for illustration only. No real company or figures are implied beyond the attached research.
An Entry Brand in sports nutrition is preparing its first Asian market. The commercial team proposes India and points to its population. The finance team prefers Japan and points to current category revenue. Both are using real figures.
The disagreement is not about the facts. The commercial team is implicitly optimising for position in a developing category. The finance team is optimising for access to established demand. Until the company decides which of the two it is pursuing, no amount of data will settle the debate, and the loudest number tends to win. Once the objective is stated, the next question becomes sharper: what would it take to enter and compete in each market? That is a different question from which market is bigger, and the first metric had hidden it.
Executives should reconsider several habits.
Decide the objective before the measure. Early revenue, category position and capability building point to different markets.
Treat population as context, not criterion. It tells you the ceiling of a conversation, not the size of a category.
Read growth in dollars as well as percentages. A faster rate on a smaller base may build position without producing a larger market.
Check that the figures belong in the same table. Different base years and forecast periods weaken any ranking built on them.
Do not exclude a market on one number or on instinct. A market that fails on size may pass on growth, and the reverse. Size is one input to the decision, not the decision.
Samana Insights’ Market Prioritisation Framework (F01) is a structured method that evaluates, scores and ranks potential Asian markets before a company commits capital, resources or partners to any one of them. Its first step, Establish Markets of Interest, asks that every market with meaningful consumer demand and existing distribution be included, and that none be excluded on gut instinct. Market size and growth enter the scoring as one input among five, weighted at 25%, which is why a single-number screen sits so badly with it.
The question for an Entry Brand is not simply which Asian market is the largest. It is largest at what, measured against which objective, and by when. A company that cannot answer those three questions has not yet chosen a metric. It has inherited one.
See how the Market Prioritisation Framework helps Entry Brands weigh Asian markets on more than one number.
Explore Our Market Prioritisation Framework